
Prepare for the ARRT Bone Densitometry (BD) credential by mastering the measurement logic behind DXA: distinguish T-scores from Z-scores, areal BMD from true volumetric density, real bone change from precision error, and genuine bone values from positioning and artifact effects. Practice by reading sample reports, computing a least significant change, and checking each conclusion against the assumptions behind it. Administrative details such as scheduling and eligibility belong to ARRT's official pages; this guide stays on the concepts and reasoning the content tests.
T-score vs Z-score: two numbers answering different questions
A T-score compares a patient's BMD with a young healthy adult reference; a Z-score compares it with age-matched peers. The exam-style skill is choosing which comparison a question is actually asking about, not computing the formula.
Both scores are expressed in standard deviations, so the raw arithmetic looks similar: subtract a reference mean and divide by a standard deviation. The difference is the reference group. A T-score always uses the peak young-adult reference population, which makes it a measure of absolute departure from peak bone mass. A Z-score uses a mean matched to the patient's age, which makes it a relative standing within that age group.
Because they answer different questions, they lead to different conclusions from the same BMD value. An older adult can have a Z-score near zero while the T-score is clearly low, simply because bone declines with age in the reference group too. In a paper scenario, first identify which reference population the question implies, then decide whether the answer depends on absolute bone status or on whether the patient is unusual for their age. Practicing that identification step converts two confusable terms into one clear decision rule.
Compare the two side by side until the distinction is automatic: reference population, meaning of zero, meaning of a negative value, and the typical follow-up question each supports. If you can explain why the same BMD can produce a worrisome T-score and an unremarkable Z-score, you understand the concept; if you cannot, the distinction is still memorized rather than learned.
- T-score: measured BMD minus young-adult mean, divided by the young-adult standard deviation
- Z-score: measured BMD minus age-matched mean, divided by the age-matched standard deviation
- Same patient, same scan, two different conclusions depending on which comparison you report
| Feature | T-score | Z-score |
|---|---|---|
| Reference group | Young healthy adult population | Age-matched peers |
| Question answered | How far from peak bone mass? | Typical for this age or not? |
| Useful follow-up | Classification discussions based on clinical criteria | Whether an age-adjusted finding warrants attention |
What DXA actually measures: aBMD, BMC, and area
DXA reports areal BMD: bone mineral content divided by projected bone area, in g/cm². It is a two-dimensional projection, not a true three-dimensional density, and that limitation drives many interpretation questions.
DXA passes two X-ray energies through the body and separates bone from soft tissue, yielding bone mineral content (BMC, in grams) over a projected area (in cm²). Dividing gives areal BMD (aBMD, g/cm²). Because the projection flattens depth into a single plane, a larger bone with the same volumetric mineralization spreads its mineral over more projected area and can show a lower aBMD. This is why aBMD is size-dependent in a way true volumetric density is not.
That size dependence explains several classic confusions. Larger skeletal frames tend toward higher aBMD; smaller frames toward lower aBMD, independent of tissue-level density. In a scenario, a patient with a notably small build may show a low spine aBMD that partly reflects bone size rather than reduced mineral per unit volume. Recognizing that aBMD is a ratio of content to projected area lets you explain why alternatives such as estimated volumetric measures exist and why the projection method is an approximation applied consistently, not a flaw you can correct at the console.
Build fluency by defining each term separately: BMC is a mass, area is a projection, aBMD is their ratio. Then practice restating a report line in plain language. If you can say what physically changed when BMC, area, or both change, you can answer reasoning questions rather than definitional ones.
- BMC: bone mineral content, a mass in grams
- Area: the projected two-dimensional bone area in cm²
- aBMD: the ratio g/cm², an areal value, size-dependent by construction
Explore in 3D: Right Femur: Orientation and Key Ends
The femur is the thigh bone. This model shows one whole bone, the right femur, as a single selectable structure. You can identify side and ends by checking that the head faces medially at the proximal end, while the distal end helps form the knee.
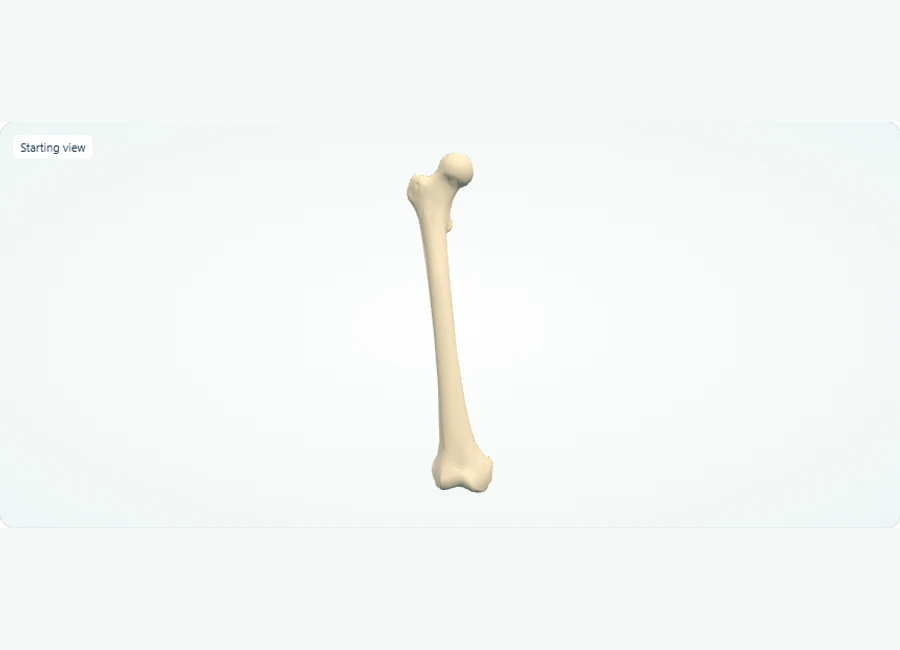
Rotate, isolate structures, and test your recall.
Locate the rounded head at the proximal end. In the body, this head faces medially toward the midline.
Switch between Front and Back to compare the proximal head with the broader distal end at the knee.
Zoom and rotate to review the ends again. Only the whole bone is selectable; individual landmarks do not have separate labels.
Try it yourself
Which end of the femur has the rounded head, and does that head face toward or away from the body’s midline?
Show answer and explanation
The proximal end has the rounded head. It faces medially, toward the body’s midline.
The femoral head is proximal, at the hip. The broader distal end contributes to the knee. Use anatomical directions relative to the body; screen directions change when the model is rotated.
- The femur lies in the thigh and is the single bone of that region.
- The head faces medially at the proximal end; use this to tell anatomical right from left on screen.
- The distal end of the femur contributes to the knee joint.
Precision error and least significant change: when is a difference real?
Serial BMD changes smaller than the facility's least significant change (LSC) are indistinguishable from measurement noise. LSC derives from the scanner's precision error, and comparing change to LSC is a core applied skill.
Every scanner and operator combination has a precision error: the variability seen when the same subject is measured repeatedly under the same conditions. From that error you compute the least significant change, the change large enough to be statistically distinguishable from noise at a stated confidence level. In a clearly labeled worked example: if repeated-measure precision error is 1.5%, a commonly taught approximation multiplies by 2.77 to give an LSC of roughly 4.2%. A measured change of 3% would then be within noise.
The practical discipline is refusing to narrate small changes as improvements or losses. In scenarios, an LSC comparison changes what you would say about a follow-up study: below LSC, report stability; above LSC, report a genuine change and consider whether any technical factor explains it. This also connects to quality control: routine phantom measurements track whether the machine's calibration is drifting over time, and a drift in phantom values undermines every patient comparison made across that period. Monitoring, precision assessment, and LSC form one coherent chain rather than three isolated facts.
Practice computing LSC from a given precision error and then classifying sample changes as stable or real. The arithmetic is simple; the discipline of checking against LSC before interpreting is the habit the scenarios reward.
- Precision error: repeat-measure variability of the same subject on the same scanner
- LSC: the change threshold above which a difference is statistically meaningful
- Phantom monitoring: detects calibration drift that would corrupt serial comparisons
Artifacts and positioning: why the number may not describe the bone
Degenerative change, surgical hardware, vascular calcification, and positioning errors can all inflate or distort reported BMD at a region. Reading a report means asking whether the measured region faithfully represents the bone.
DXA cannot distinguish mineral inside bone from dense material overlapping the bone's projection. Osteophytes, facet sclerosis, aortic calcification overlying the spine, swallowed contrast, or orthopedic hardware all add projected density and bias the result upward. Positioning problems act differently: rotation, incorrect region placement, or artifacts in the soft-tissue reference can shift values without any biological change. The common thread is that the reported number describes the measured projection, not automatically the patient's skeleton.
A reliable reasoning pattern for scenarios: look for internal inconsistency, such as one lumbar vertebra reading far higher than its neighbors, a spine result sharply discordant with the hip, or a large unexplained change since the prior study. Then ask what physical process could produce that pattern. A single inflated vertebra suggests focal degenerative change; a globally discordant spine suggests systematic overlap or hardware. This pattern-matching converts artifact recognition from a list to be memorized into a physical argument you can construct on any unfamiliar case.
Note also that patient safety in densitometry centers on justified, low-dose imaging and avoiding unnecessary repeats, so a careful first-pass review that catches an artifact protects the patient from a repeat acquisition as well as from a wrong report.
- Upward bias sources: osteophytes, facet sclerosis, hardware, vascular or soft-tissue calcification
- Consistency checks: vertebra-to-vertebra agreement, spine-versus-hip concordance, change since prior study
- Documentation habit: note any excluded region and the reason in the report
Worked scenario: is a 3.2% BMD increase real improvement?
A follow-up spine scan shows a 3.2% rise. The tempting call is improvement; the disciplined call is to check the change against the facility LSC before describing anything as a genuine change.
Scenario: a follow-up lumbar spine study 14 months after baseline reports L1–L4 aBMD up 3.2%. The referring note asks whether therapy is working. A common mistake is to describe the finding as a solid improvement because the number is positive and looks substantial. That reasoning treats measurement noise as biology and could support a false treatment narrative.
The better decision applies the chain from earlier sections. Suppose the facility's precision assessment yielded 1.5% error; the worked-example LSC is about 4.2% (1.5 × 2.77), so 3.2% is below threshold and the honest report is 'no significant change.' At the same time, check quality: were acquisition parameters identical, is positioning comparable, and did phantom records show any drift between the two dates? Suppose instead the facility error were 1.0%, giving an LSC near 2.8%; then 3.2% would clear the threshold and merit interpretation, with a glance for degenerative change that could inflate the spine value. Why it matters: the same 3.2% supports opposite conclusions depending on the measurement context, which is exactly the reasoning these scenarios are built to test.
Drill this structure until it is reflexive: state the measured change, state the LSC, classify the change, then audit acquisition consistency. The verdict always follows the context, never the raw percentage.
- Mistake: interpreting any positive change as clinical improvement
- Better: compare the change to the facility's own LSC before characterizing it
- Why it matters: the same percentage can be noise at one facility and a real change at another
Worked scenario: one vertebra reads far higher than the rest
When a single lumbar level is markedly discordant with its neighbors, the likely problem is a local artifact, and the disciplined response is to exclude the affected level per protocol and document the exclusion.
Scenario: a lumbar study shows L1, L2, and L4 agreeing closely while L3 reads dramatically higher, and the spine T-score looks far more favorable than the hip. A tempting mistake is to accept the four-level average because it is the default output. That choice lets one anomalous level, plausibly a fracture-related change or degenerative sclerosis, pull the entire spine result upward and mask what the hip suggests.
The better decision reasons physically: a single discordant level indicates something local, not a whole-skeleton shift. Standard practice favors evaluating each vertebra, excluding the invalid level using the facility's protocol, and reporting the valid levels, with the exclusion and its reason documented. The hip, unaffected by lumbar artifacts, serves as a cross-check; a marked spine–hip discrepancy should itself prompt review rather than be averaged away. Why it matters: the reported classification could change depending on whether an artifact-bearing level is silently included, so the exclusion decision is not a technical nicety but the difference between describing the patient's skeleton and describing a superimposed structure.
Convert this into a checklist habit for any multi-level report: inspect level-to-level agreement, hunt for a physical explanation for discordance, apply the documented exclusion rule, and verify the hip or alternative region tells a coherent story.
- Red flag: one level sharply above its neighbors or the hip result
- Response: exclude the affected level per protocol and document why
- Cross-check: use a non-affected region before finalizing any conclusion
A practice sequence and readiness checks for BD preparation
Sequence preparation in layers: definitions, then calculation drills, then report-reading, then full paper scenarios, checking each layer with specific observable outputs rather than a feeling of familiarity.
A realistic adaptable sequence: spend the first stretch building the vocabulary precisely — T-score, Z-score, BMC, area, aBMD, precision error, LSC, phantom monitoring — writing your own one-sentence definition for each. Next, drill calculations with self-made numbers: convert BMD values into T- and Z-scores given reference data, and convert precision errors into LSCs. Third, gather sample or practice DXA reports and, for each, name the regions reported, check internal consistency, and list any artifact candidates. Finally, run full paper scenarios end to end, writing conclusions in complete sentences as you would in a report.
A concrete exercise: create a practice log of ten fictional follow-up cases. For each, record the measured change, the assumed precision error, the computed LSC, and a one-line verdict of stable, increased, or decreased. Then self-check with a rubric: did you compare to LSC before interpreting (yes/no), did you name an artifact check (yes/no), did your conclusion follow the numbers rather than your first impression (yes/no)? Observations to expect from honest scoring: early cases will show verdicts issued before the LSC check, which is the exact habit to correct. Scores on such self-checks are learning milestones for your own feedback, not predictions of any exam result.
Readiness checks you can actually verify: define every core term without notes; compute T-score, Z-score, and LSC from supplied values within one error-free pass; for three unfamiliar scenarios, state the mistake available, the better decision, and the reason; explain in two sentences why aBMD is size-dependent; and restate the artifact-exclusion workflow from memory. For scheduling, eligibility, and administrative requirements, consult ARRT's official credential pages directly, as this guide deliberately avoids restating logistics.
- Layer 1: precise definitions written in your own words
- Layer 2: T-score, Z-score, and LSC calculation drills with self-made values
- Layer 3: report reading with consistency and artifact checks
- Layer 4: full paper scenarios with written conclusions and rubric scoring
References and further reading
Use these references to explore the concepts and check the latest information from the relevant organizations.